Describe your linear data
Compute simple statistical linear regression models that relate a dependent to an independent variable.
Learning objectives
At the end of this session you should be able to
- discuss different indicators relevant for the assessment of linear regression results,
- graphically evaluate properties of linear regression,
- numerically evaluate properties of linear regression.
Basic idea of statistical modeling
Use observation samples to describe the relationship between a dependent variable and one or more independent variables.
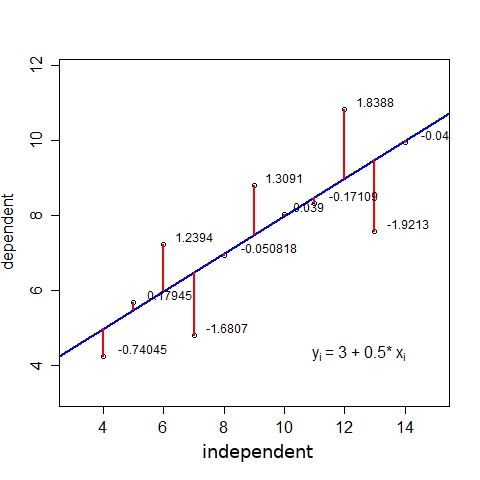
The graphic above shows a scatter plot of data pairs between independent (X axis) and dependent (Y axis) variables. The relationship is estimated by a linear regression model illustrated by a blue line. The model coefficients are given in the equation. Residual values are additionally indicated by red lines.
Linear regression 101
Using statistical models for relating independent and dependent variables in order to describe relationships between the recorded data pairs or predict (interpolate) values in a range where no data pairs have been observed is a key method in environmental sciences. A bivariate linear regression model is the simplest form of such a statistical model. However, if the quality of a linear regression model is assessed by the commonly computed internal test statistics (e.g. p-values, t-test, R square), the following aspects have to be kept in mind (Y is the dependent, X the independent variable):
- Linear regression models are only appropriate for linear relationship between independent and dependent variables.
- Linear regression models require at least as much observations as independent variables (and better much more).
- Residuals of linear regression models must be normality distributed which is equivalent to the normal distribution of Y at each observation X (and which is not equivalent to the common statement that X and Y must be normally distributed).
- The variance of the linear regression residuals must be homogeneous (i.e. homoscedasticity) which is equivalent to the homogeneity of the variance of Y at each observation X.
- The residuals of the linear regression model must be independent which is equivalent to the independence of Y for different observations X.
- The X values must not be random but are exact or show only a very small noise compared to Y.
- If more than one independent variable is used in the model (i.e. multiple linear regression), each independent variable must not be a linear combination of other one or more other independent variables (i.e. no multicollinearity).
Note that the commonly computed test statistics do not have any meaning for using linear regression models to predict data but only to describe a relationship between the known observations.